Friday, January 2, 2015

Fake "The Interview" app


It has been more than a month now since the epic hack on Sony Pictures and one thing that Sony has benefited from this is the publicity and marketing of their movie "The Interview", a comedy on assassination of North Korean President Kim Jong-Un. 

It has been reported that one of the motives of the hack is to stop the releasing of this movie. This motive spurs curiosity and people wanted to see the movie despite threats by the hackers. To cut the story short, Sony decided to release the movie on December 24, 2014.


Following the release of the movie, cybercriminals took advantage of it by releasing an android application that poses as streaming app for the movie. 


The app does not have something special like autostart, receivers or services. It just have one activity which downloads another apk file hosted in AWS.


It will download from the following shortened URLs and will save the file in sdcard as "test.apk".

McAfee has reported that the downloaded apps are banking trojans.
However, during our testing, the downloaded apk files seems to be a corrupt apk which is a good thing as it will not be installed into your device. Amazon also took action by removing the file from servers.


One interesting thing about this app is that it will not download if the device names are as follows:
  • 삼지연
  • 아리랑
These are devices that are being sold in North Korea which makes you think, if this malware comes from North Korea.


Whether this comes from North Korea or not, it is important to always be mindful of what you are doing online. Cybercriminals will always find a way to steal money and now, with so many platforms to choose, it seems to be easier for them to do cybercrime.

Stay safe.


Tuesday, June 10, 2014

SimpleLocker: Android version of Cryptolocker

In our previous blog about ransomware in android, we talked about how the windows malware are slowly shifting to mobile. Just this week, a new android malware called Simplelocker emerged and it does work similar to the windows Cryptolocker malware.

Let us take a look at the functionality of this malware.

The sample we are going to analyze is found contagiominidump.blogspot.com.

The app when installed has the following icon:


When executed, it will display the following which also locks your screen.


The message states that the user's device is locked and you must pay 260 UAH using the service MoneXy to unlock the device.

This malware has a service that starts two scheduled tasks and one thread. The first task is for C&C communication and the second task is for screen locker. The created thread is for encrypting files in the SD card.


C&C Communication

The first scheduled task is set to repeat every 180 seconds. Its purpose is to contact its C&C server via TOR service and check with the server if the infected user has already paid. It sends the following information as part of the check:

  • Device Id
  • Client Number (could be equal to bot id)
  • Type


It send it to "http://xeyocsu7fu2vjhxs.onion/" and check for the "stop command" from the C&C server which directs the app to unlock the device and decrypt the files.


Screen Locker

The second task is set to repeat every 1 second and it just restarts the main activity which displays the lock message and thus locks your screen.


File Encryptor

The file encryptor thread will look for specific files in the SD card and encrypt them using AES-256. It is looking for the files with extensions, jpeg, jpg, png, bmp, gif, pdf, doc, docx, txt, avi, mkv, 3gp, and mp4.  Encrypted files are appended with .enc extensions. The key is hardcoded in the app unlike the cryptolocker in which the key used in encrypting files is further encrypted using an RSA-2048 public key coming from the C&C server. . It also includes a decrypt function which executed when it receives the "stop command" from the C&C server.


Tuesday, May 27, 2014

Analysis of IBanking malware

The bad guys are now increasing their attack on mobile. A malware toolkit called IBanking is being sold up to US$5,000 in underground. Last February, the source code was leaked and following this is an uptick of occurrence of this malware in the wild. You can read the full story in Symantec blog post.

A number of samples were submitted to contagio and with my reversing skill and curiosity kicking in, I analyzed one of the sample.

Filename: 1F68ADDF38F63FE821B237BC7BAABB3D_IBanking_Chase.apk

When you first start the app, it will force itself to be installed as a device administrator so that even if you cancelled, it will re-launch the screen where it asks the user again if you want to install it as administrator. I am not sure how it was programmatically done. 


Installing this app as administrator enables the app to wipe your data and lock your phone.


This malware disguises itself as an anti-virus program but it just fakes the scan and do some nasty things.


Command and Control

This bot can communicate and accept commands from a web server and a phone number. The following are the CnC servers for this malware.

  • myredskins.net
  • mynamesmith.com
  • +79067075145
  • +790670751454
The servers and numbers above are from Russia.


The CnC web servers are defined in res/values/arrays.xml


It iterates to the list of its CnC web servers and check if they are active via http POST to:

  • {domain}/iBanking/sms/ping.php


If the server replied as expected,  it will POST the following information to {domain}/iBanking/sms/index.php
  • bot_id (defined in strings.xml)
  • telephone number
  • iccid
  • device model
  • OS version
  • IMEI
  • control_number (this is the CnC phone number)


This bot can accept commands from its CnC via SMS or HTTP. It intercepts any incoming SMS  and checks the number.


Via http it reads command from:

  • {domain}/iBanking/sms/sync.php


It is looking for the following command strings:

  • sms start - tell the bot to start intercepting and reading SMS
  • sms stop - tell the bot to stop intercepting and reading SMS
  • call start  - forward calls to +79067075145
  • call stop - stop call forwarding
  • change num -  tell the bot to change the CnC phone number
  • sms list - read SMS inbox and sent messages and POST to {domain}/iBanking/getList.php
  • call list - read call history, e.g., INCOMING, OUTGOING and MISSED calls and POST to {domain}/iBanking/getList.php
  • start record - start audio recording. The file is saved as {externaldir}/Android/obb/{dd-MM-yyyy_HH-mm-ss}.txt. The files are then sent to {domain}/iBanking/sendFile.php
  • stop record -   stop recording.
  • sendSMS  - send intercepted SMS to the CnC phone number.
  • contact list - get contact list
  • wipe data - wipe data if device administrator is enabled.
  • ping - check if the CnC server is alive


Looking at how this piece of malware is capable of, it was quite scary seeing those features packed in a single malware. And it is not far fetched to see malwares soon with more powerful features. It is still advisable for users to always be smart and watchful of things they visit and install into their system. 


Tuesday, May 20, 2014

Ransomware now targeting Android

Cryptolocker, a windows ransomware has gained popularity recently. Last week, a ransomware targeting Android emerged. This ransomware is named Koler.A.

Let us take a look at what it does.

Ransomware behavior

 A user infected with this ransomware will have the following message on their screen repeatedly. It states that your phone has been locked by the authority and you need to pay $300 via MoneyPak to have your phone unlocked.


What is annoying about this ransomware is that it will takeover your screen by periodically showing the message above. This makes your phone unusable because as soon as you do something on your phone, it will override your screen.


How does it work?

LockActivity.class

First, it reads a list of URL from its resource and then loads the url via webview. Webview enables the app to display web pages inside the application. It is those urls that will show the message above. It also starts the LockService class which acts as a watchdog and will always respawn the LockActivity.


The service also sets an alarm that would trigger the LockActivity every 2000 ms.


Suspicious Code

There were many suspicious declaration in the manifest file. First, it uses package name "com.android" which is the default package name for the android system processes. Second, it uses  autostarts after boot having a priority of 999. Third, it has two receivers declared as remote which means a separate process. This is done as a watchdog for the application. We can also note that with the declared permission, READ_PHONE_STATE,  it gives you a hint that it accesses internet and phone system information (e.g., IMEI, phone number).


Code obfuscation

The malware author included code obfuscation by making the class names similar to each other which is hard for the reverser to read.


Wednesday, April 23, 2014

EBFE (Debugging a remote thread)

Creating a remote thread is a common routine for malwares. A remote thread is like a normal thread, but it is running in another process' context. It is usually done by writing the thread routine to the target running process.

This makes debugging the remote thread a little bit tricky because you need to attach a debugger to the target process (this is the process that is being injected).

However, there are some instances where you cannot attach Ollydbg to the target process because it is suspended.


To go around this, we can improvise a technique where we modify few bytes of the entry point's thread so that it will not execute. That is, we modify the thread so that it will be in an infinite loop before executing the thread.

We modify the first 2 bytes of the threads entry point with the bytes "EB FE". EB FE are the hex bytes equivalent to JMP TO SELF. In effect, when you resumed the thread, it will be in an infinite loop, an "improvised breakpoint". With this, once the thread is resumed, we can now attach Ollydbg to the target process without executing the whole thread. Before you modify, take note of the 2 bytes that you replaced because you will replace it back later. Refer to the diagram below.


Now, let us start debugging a real malware applying this concept.

We will be using the following sample:

MD5: 49e6ad4afa492b1a7e34b46a98298d5b


Let us skip to the part where it creates a suspended process and go right where it tries to write into it.
Take note of the code that it is trying to inject on the suspended process. Notice that it tries to write an executable image. With this, we can assume that the entry point of the thread will be the entry point of the executable image.


So, what we can do is to find the entry point of that executable image and replace the first 2 bytes with EBFE. To find the entry point,  we can dump the memory to file and find the offset of the entry point. In this sample, the entry point is at offset 0x168B.

We go to that offset and change the first 2 bytes. To do this:
Highlight the first 2 bytes to modify and Press Ctrl+E to edit.


Go ahead and change it to EB FE. Take note of the 2 bytes "55 8B" because you will restore it later. In most cases, this is 55 8B because it is usually the initial bytes of a function. The bytes will turn red indicating it is changed.


You can now execute until it resume the thread "kernell32.ResumeThread" or run it (F9). You will notice that the injected process will have almost 100% memory utilization because it is in an infinite loop. This also means that our "improvised breakpoint" is working. However, the good news is, since the process is not suspended, we can attach our debugger to it.


To attach, open new instance of OllyDbg and click File>Attach>(Choose the PID in hex of the process we want to attach). In our case PID is 2960 which is 0xB90.


When you attach, you will notice that it will be in some address not on the remote thread.


Just press F9 to run it then press F12 to go where our EIP is. We don't bother running it because it is in an infinite loop anyway.  After pressing F12, we expect our EIP to be at EBFE.


And hooray!! Our EBFE is hit. Now you can highlight the code and press Ctrl+E to restore the bytes "55 8B". After restoring the original bytes, we can now fully debug our remote thread.

Final Words

In some cases, there are remote threads where the target process is not suspended. For example, a malware will create a remote thread to a running explorer.exe. In this case, we can easily attach our debugger to it locate the address of the injected code and set breakpoint. Or we just easily attach to it, then "set breakpoint on new thread" and run it. As soon as the remote thread is resumed, Ollydbg will breakpoint at the thread's entry point.

Of course we can also use Windbg which I think is more powerful but we can reserve that tutorial later as I am more experienced with Ollydbg:)

Hope you learn something today. Cheers!


Thursday, April 10, 2014

Unpacking using Ollydbg

For years, malware take advantage of packers to protect themselves against reverse analysis and AV detection. Third party packers such as UPX, PECompact, Aspack, etc. were being used by malware for years to somehow evade antivirus detection and make reversing difficult . However, due to the fact that these are available tools, AV companies and reversers where able to study them and thus malwares packed with such third party packers can be easily unpacked these days. Today however, malware using a so called hacker-packer is proliferating. Unlike packers such as UPX, hacker-packer tools are not readily available. They are sold and distributed usually underground.

In this blog, we will discuss a technique to unpack most malware using Ollydbg. To start let us first look on the following useful Ollydbg features. We will be using these features for unpacking a malware sample.

  • F9 - Run the program
  • F2 - Set breakpoint
  • ALT+F9 - Return to user code
  • CTRL+G - Go to an expression, e.g., specific address, address of API or addresses pointed by the registers.
  • Follow in Dump - This allows to view the contents of a memory in Ollydbg's memory address view.


We will be using a real malware that came from a spam. You can find the virustotal hits of this sample here. You also notice that it is not using a commercial packer.


Let us now unpack the sample.

1. Load the sample in Ollydbg.
2. Set breakpoint in VirtualAlloc. This is on the assumption that the sample uses VirtualAlloc api. In some cases it uses the native api, ZwAllocateVirtualMemory.  To do this, press CTRL+G and type VirtualAlloc (case sensitive) then Enter. This will point you to the address of VirtualAlloc. Press F2 to set breakpoint.


3. Press F9 to run the sample.
4. If the breakpoint is hit, press ALT+F9 to go to back  to user code.
5. Right click on the value of EAX on the registers section and click "Follow in Dump"


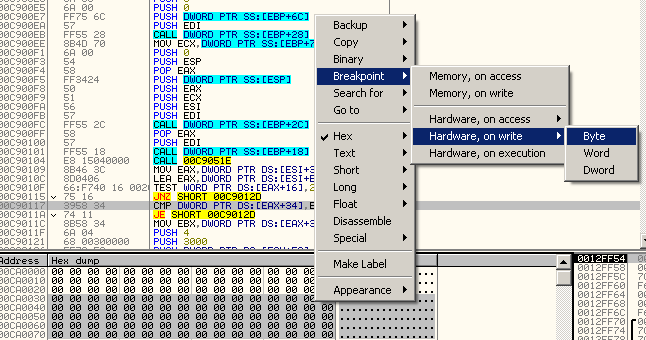
6. Highlight a few bytes on the Memory View and right click. Then select  Breakpoint>Hardware, write>Byte. Then Press F9 to run again the sample. We do this because, when a sample uses VirtualAlloc, that means it is preparing to write something on the allocated memory. We wanted to breakpoint on that as soon as it is being written.


7. If the breakpoint is hit, examine the data. Is it already a PE image? In our case, not yet. Maybe it is still the second layer encryption routine. For this case, press F9 again to run the sample and hope that the VirtualAlloc is hit again.


8. Redo the steps 4,5 and 6.
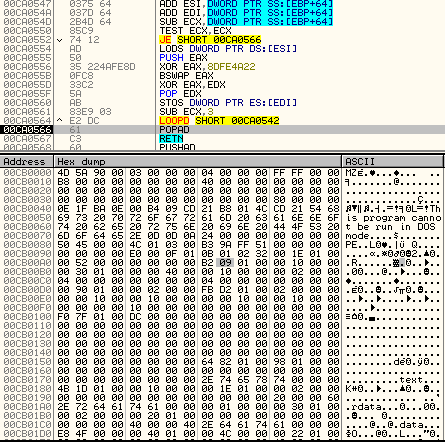
9. Now the breakpoint is hit and we now see the MZ header. However, it seems it is not yet fully decrypted. We examine the code and it appears to be in a loop. This appears to be the last layer of decryption. Just finish the loop.


10. We are now looking at the decrypted PE file.


11. We just have to dump the memory and we have now an unpacked file.


Additional Notes:

In some cases, the sample is not using VirtualAlloc api so you might be wondering why your breakpoint is not hit. Try ZwAllocateVirtual memory or HeapAlloc. Also, the Breakpoint>Memory, on access can be used in placed for the hardware breakpoint.

Hope you learn something today. Cheers:)


Sunday, August 4, 2013

Debugging apk files using Netbeans

Debugging apk files using Netbeans


As of this writing, there have been limited real time debugging methods for android apk applications.

This tutorial will talk about debugging android applications step-by-step.


Tools Needed:

1. Netbeans IDE 6.8. You can download it here. Restart your system after installation.
2. apktool.jar (version 1.4.1).  It will only work in this version. Download it here.
3. Signing tool.  You can download my signing tool here.

Step-by-step Instruction:

1. Decode your .apk file  using -d option of apktool. Example If you want to decode it in "out" directory type:
 java -jar apktool.jar d -d my.app.apk out

*Note that the out above is where the decompiled files will be saved. You can use any folder name here.

2.  Open the out folder and open AndroidManifest.xml. Add android:debuggable="true" attribute to <application> section in out/AndroidManifest.xml file.


3. Rebuild your apk.
java -jar apktool.jar b -d out my.app.to.debug.apk

4. Sign and install my.app.to.debug.apk.
5. Delete out/build and out/dist folder. This is because, netbeans will not allow you to create from existing project when those folders exists.
6. Run NetBeans, click "File" -> "New Project". Choose "Java"->"Java Project with Existing Sources". Click "Next".
7. Specify out as "Project Folder". Click "Next".
8. Add out/smali folder to the "Source Package Folder" list. Click "Next" and then "Finish".
9. Start the app on the device, run DDMS, find your application on a list and click it. Note port information in last column - it should be something like 86xx / 8700".
10. In Netbeans, click "Debug" -> "Attach Debugger" -> select "JPDA" and set "Port" to 8700 (or whatever you saw in previous step). Set your host to "localhost". Rest of fields should be ok, click "OK".
11. Debugging session should start: you will see some info in a log and debugging buttons will show up in top panel.
12. Set breakpoint.  You can't set breakpoint on lines starting with ".", ":" or "#". You must select line with some instruction
13. Trigger some action in application. If you run at breakpoint, then thread should stop and you will be able to debug step by step, watch variables, etc.

Other way of setting a breakpoint:

Notice that  you have to actually execute the app before you can attach the debugger. In most cases, we don't want this because some of the codes already executed. To get away with this, we can use the waitForDebugger() function.
1.  add the following smali code on the onCreate() method of the launcher activity.
   Insert
invoke-static {}, Landroid/os/Debug;->waitForDebugger()V
   After
 invoke-super {p0, p1}, Landroid/app/Activity;->onCreate(Landroid/os/Bundle;)V
  
 2.  Do steps from 3 to 11 from above. You will see just a black screen after you start the application on step 9; don't worry, it's normal. If Android proposes you to close the application because the application does not respond, reject the proposition. The application is frozen at the very beginning of execution, it is waiting for the debugger.

3. Set a breakpoint on the first instruction after invoke-static {}, Landroid/os/Debug;->waitForDebugger()V in theonCreate(...) method and continue execution. Your breakpoint will be hit and you will be able to debug the application step by step from the very beginning, watch variables, etc.