This makes debugging the remote thread a little bit tricky because you need to attach a debugger to the target process (this is the process that is being injected).
However, there are some instances where you cannot attach Ollydbg to the target process because it is suspended.

To go around this, we can improvise a technique where we modify few bytes of the entry point's thread so that it will not execute. That is, we modify the thread so that it will be in an infinite loop before executing the thread.
We modify the first 2 bytes of the threads entry point with the bytes "EB FE". EB FE are the hex bytes equivalent to JMP TO SELF. In effect, when you resumed the thread, it will be in an infinite loop, an "improvised breakpoint". With this, once the thread is resumed, we can now attach Ollydbg to the target process without executing the whole thread. Before you modify, take note of the 2 bytes that you replaced because you will replace it back later. Refer to the diagram below.

Now, let us start debugging a real malware applying this concept.
We will be using the following sample:
MD5: 49e6ad4afa492b1a7e34b46a98298d5b
Let us skip to the part where it creates a suspended process and go right where it tries to write into it.
Take note of the code that it is trying to inject on the suspended process. Notice that it tries to write an executable image. With this, we can assume that the entry point of the thread will be the entry point of the executable image.

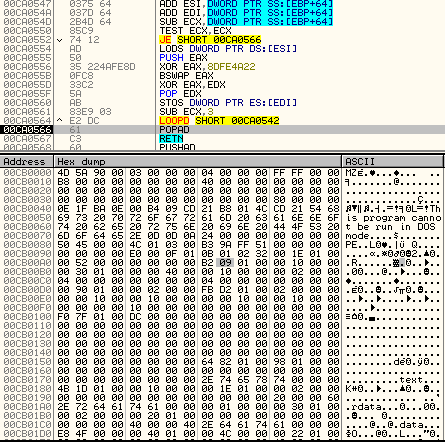
So, what we can do is to find the entry point of that executable image and replace the first 2 bytes with EBFE. To find the entry point, we can dump the memory to file and find the offset of the entry point. In this sample, the entry point is at offset 0x168B.
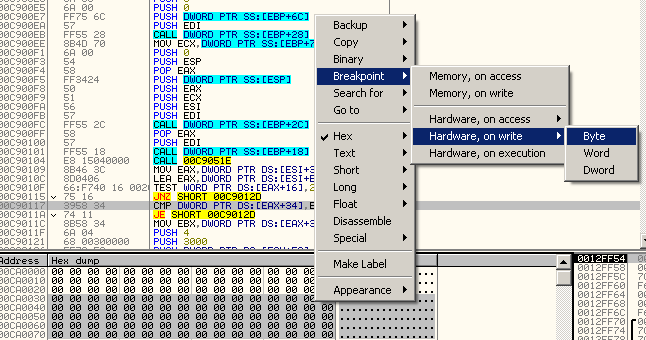
We go to that offset and change the first 2 bytes. To do this:
Highlight the first 2 bytes to modify and Press Ctrl+E to edit.

Go ahead and change it to EB FE. Take note of the 2 bytes "55 8B" because you will restore it later. In most cases, this is 55 8B because it is usually the initial bytes of a function. The bytes will turn red indicating it is changed.

You can now execute until it resume the thread "kernell32.ResumeThread" or run it (F9). You will notice that the injected process will have almost 100% memory utilization because it is in an infinite loop. This also means that our "improvised breakpoint" is working. However, the good news is, since the process is not suspended, we can attach our debugger to it.

To attach, open new instance of OllyDbg and click File>Attach>(Choose the PID in hex of the process we want to attach). In our case PID is 2960 which is 0xB90.

When you attach, you will notice that it will be in some address not on the remote thread.

Just press F9 to run it then press F12 to go where our EIP is. We don't bother running it because it is in an infinite loop anyway. After pressing F12, we expect our EIP to be at EBFE.

And hooray!! Our EBFE is hit. Now you can highlight the code and press Ctrl+E to restore the bytes "55 8B". After restoring the original bytes, we can now fully debug our remote thread.
Final Words
In some cases, there are remote threads where the target process is not suspended. For example, a malware will create a remote thread to a running explorer.exe. In this case, we can easily attach our debugger to it locate the address of the injected code and set breakpoint. Or we just easily attach to it, then "set breakpoint on new thread" and run it. As soon as the remote thread is resumed, Ollydbg will breakpoint at the thread's entry point.
Of course we can also use Windbg which I think is more powerful but we can reserve that tutorial later as I am more experienced with Ollydbg:)
Hope you learn something today. Cheers!